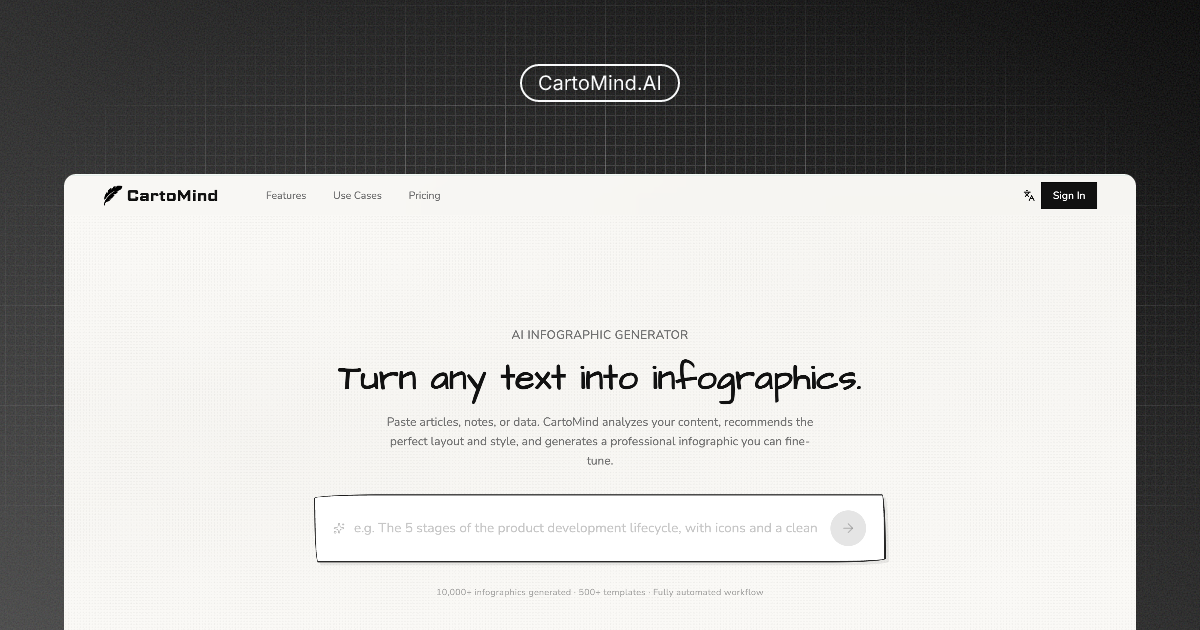
In a world where data is abundant but attention is scarce, communicating complex information effectively is a critical challenge. Traditional infographic creation requires design skills, time, and resources that many professionals simply don't have. CartoMind AI solves this by democratizing data visualization—turning your text, statistics, and concepts into stunning, shareable infographics in moments, not hours.
CartoMind is an AI-powered infographic generator that leverages advanced algorithms to understand your content and automatically create visually compelling data stories. Unlike template-based tools that force you into rigid designs, CartoMind's AI analyzes your input to suggest optimal layouts, color schemes, and visualization types that enhance comprehension and engagement. The platform bridges the gap between raw data and compelling visual communication, making professional-grade infographics accessible to marketers, educators, business analysts, and content creators without requiring design expertise.
Key Features
-
AI-Powered Content Analysis: CartoMind's core technology goes beyond simple text-to-image conversion. The system intelligently parses your input—whether it's statistical data, research findings, or conceptual information—to identify key points, relationships, and hierarchies. It then recommends the most effective visualization methods (charts, timelines, process flows, comparison matrices) to represent your information clearly and persuasively.
-
Customizable Smart Templates: While the AI provides a strong starting point, CartoMind offers fully customizable templates that adapt to your content. These aren't static layouts—they're dynamic frameworks that reorganize based on your data volume and type. Adjust colors, fonts, spacing, and element placement with an intuitive drag-and-drop interface while maintaining visual coherence and professional polish.
-
Collaborative Design Workflow: CartoMind supports team-based creation with real-time collaboration features. Multiple users can edit, comment, and approve infographics simultaneously, with version history tracking all changes. This makes it ideal for organizations where infographics need input from subject matter experts, marketing teams, and leadership before publication.
-
Data Visualization Integration: The platform seamlessly integrates with common data formats and allows for direct data input. Create bar charts, pie graphs, line charts, and more complex visualizations directly within the editor. The system can also generate explanatory text captions and annotations that highlight key insights, creating a complete narrative around your data.
-
Export and Sharing Optimization: CartoMind optimizes your infographics for any platform or purpose. Export in high-resolution PNG, PDF for print, or SVG for web development. The platform includes built-in social media sizing presets and provides analytics on how different visual elements perform when shared, helping you refine your visual communication strategy over time.
Get Started
Getting started with CartoMind requires no design experience or technical setup. Simply create an account on their web platform, and you can begin generating infographics immediately. The interface guides you through three simple steps: input your text or data, let the AI generate initial design options, and then customize to perfection using the intuitive editor. The platform offers comprehensive tutorials, a library of example projects, and responsive customer support. With its freemium model, you can explore core functionality at no cost, making it easy to evaluate whether CartoMind fits your workflow before committing to premium features that unlock advanced templates, higher-resolution exports, and team collaboration tools.